PEAKS Studio 8.5 New Feature Highlights
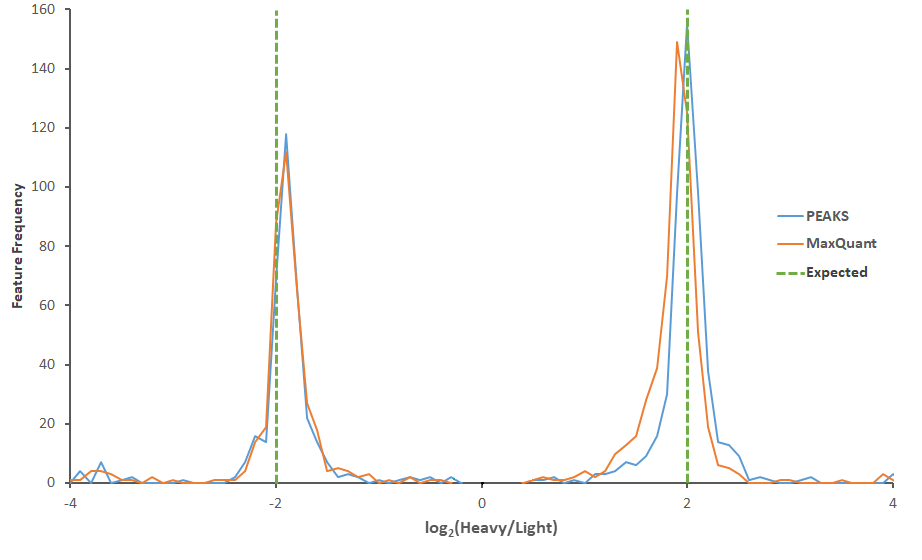
SILAC Quantification
- Improved accuracy and sensitivity by enhanced SILAC pair feature detection and alignment
- Ratio-focused quantification (e.g. super-SILAC)
- Multiple group comparison (e.g. time series quantification)
- More statistics:
- Paired t-test for single-group analysis
- Welch’s ANOVA for multiple group comparison
Read our application note for SILAC-based quantitative proteome analysis with PEAKS.
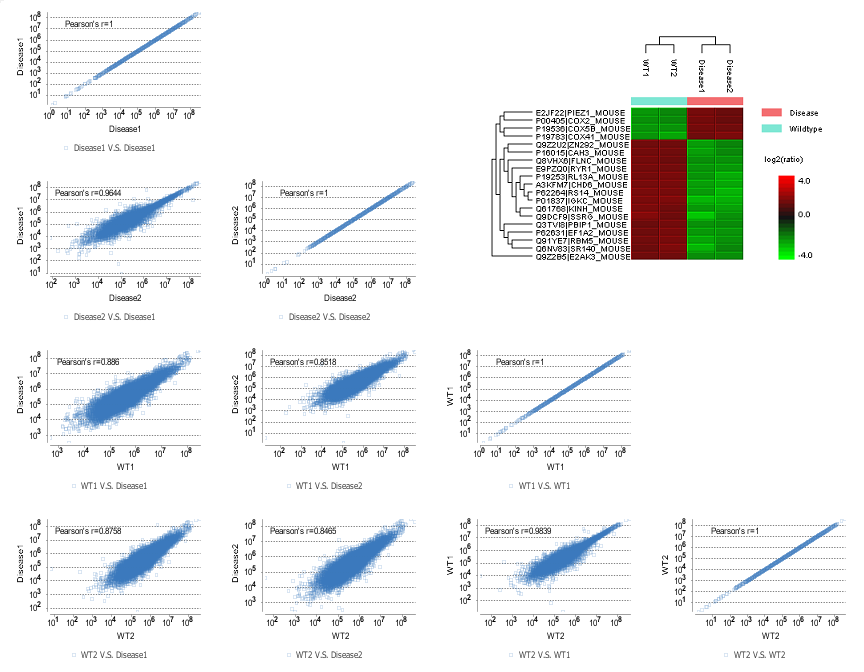
Label Free Quantification
- Top-three unique peptides selected for LFQ
- Improved LFQ accuracy by enabling exclusion of 1) peptides with both modified and unmodified forms, and 2) redundant peptides
- Peptide-level quantification provided in peptide table
- Sample clustering and correlation views
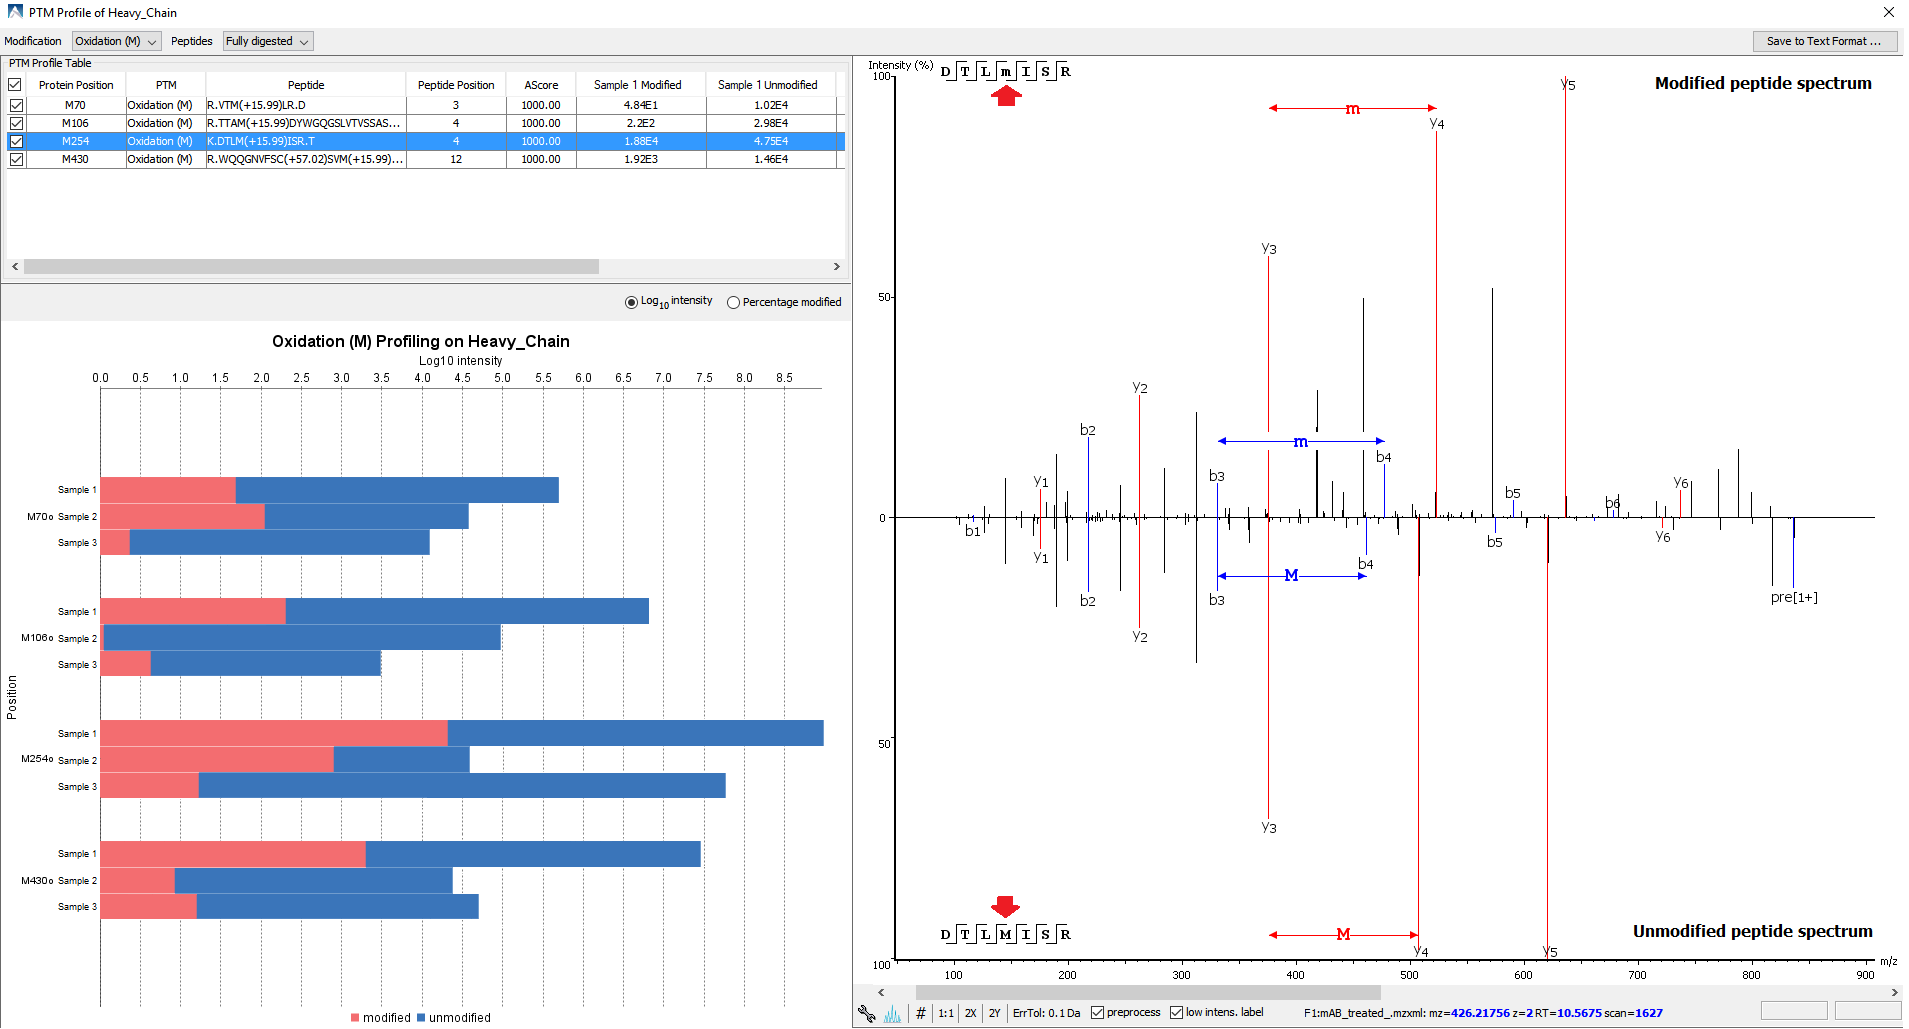
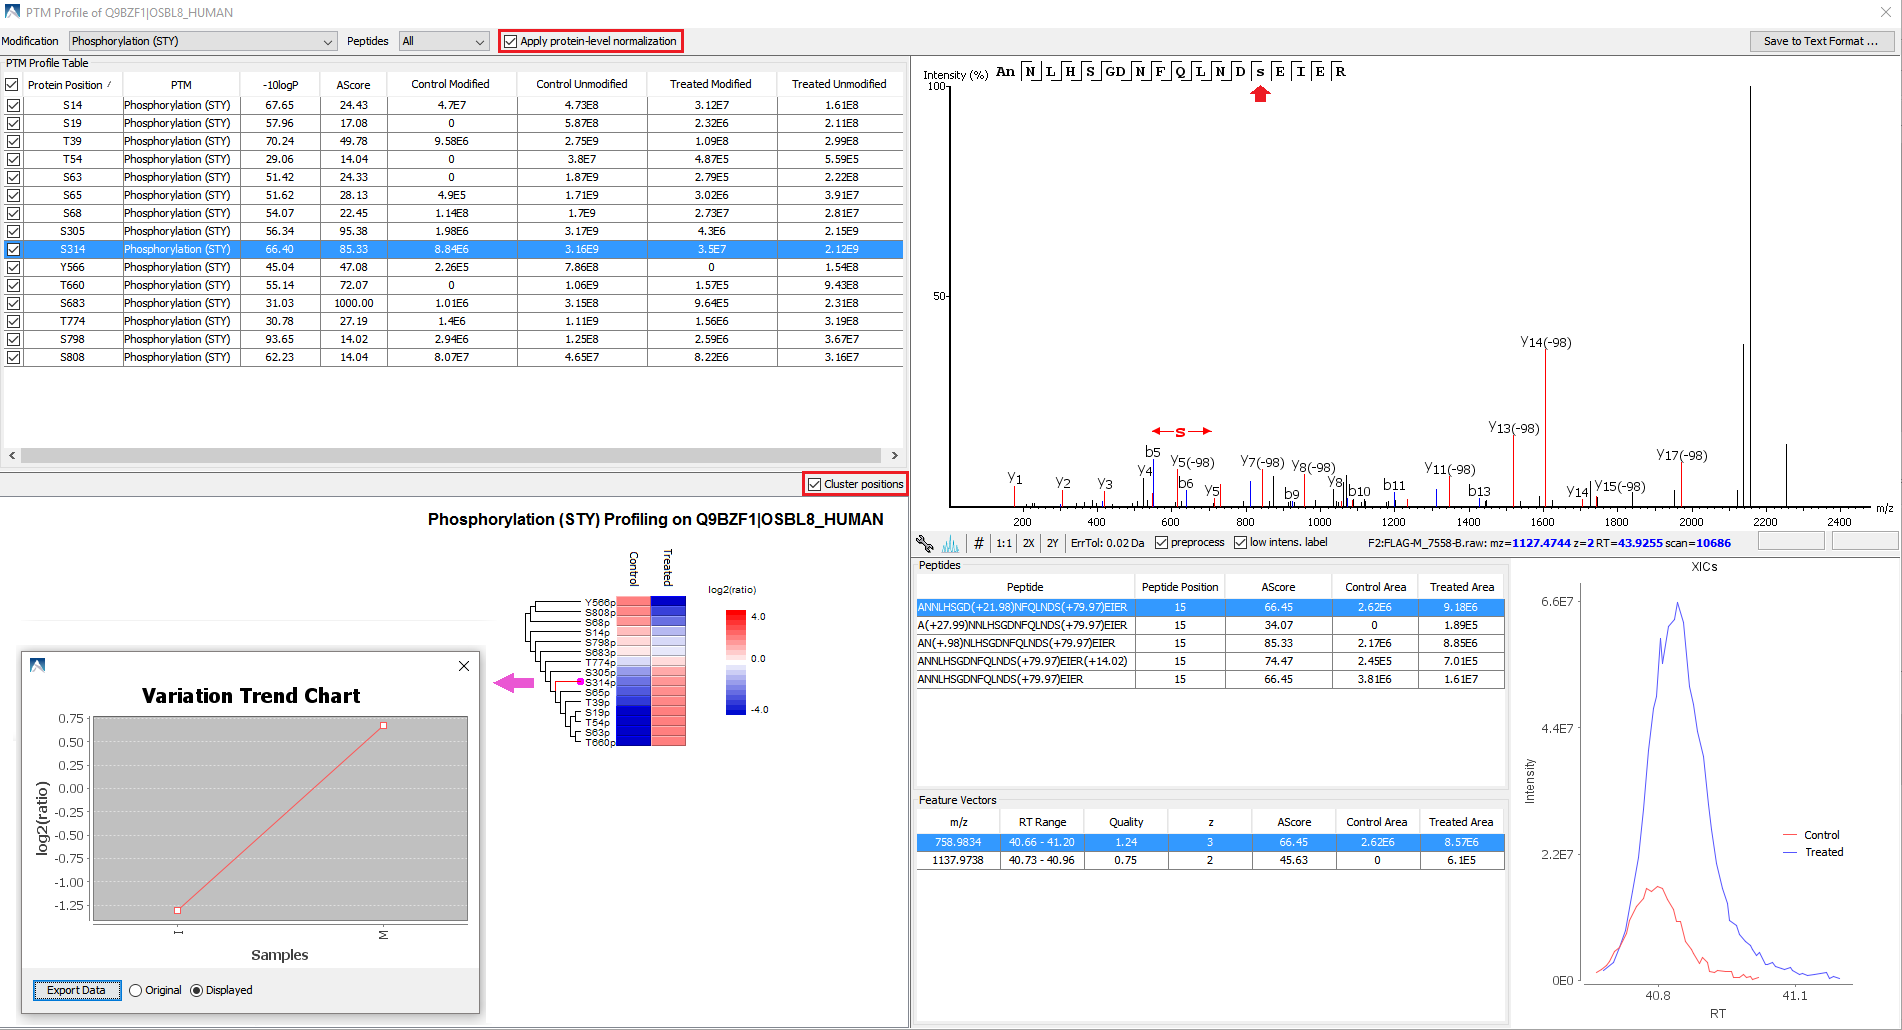
PTM Profiling
- Enhanced PTM profiling enabled in:
- Identification result (LEFT): multi-sample PTM comparisons; MS2 spectra comparison of modified v.s. unmodified peptides
- Quantification (Q) result (RIGHT): confident PTM quantitation filtered by A-score or minimum ion intensity threshold; normalized by protein expression levels; PTM site clustering; modified peptide / feature details
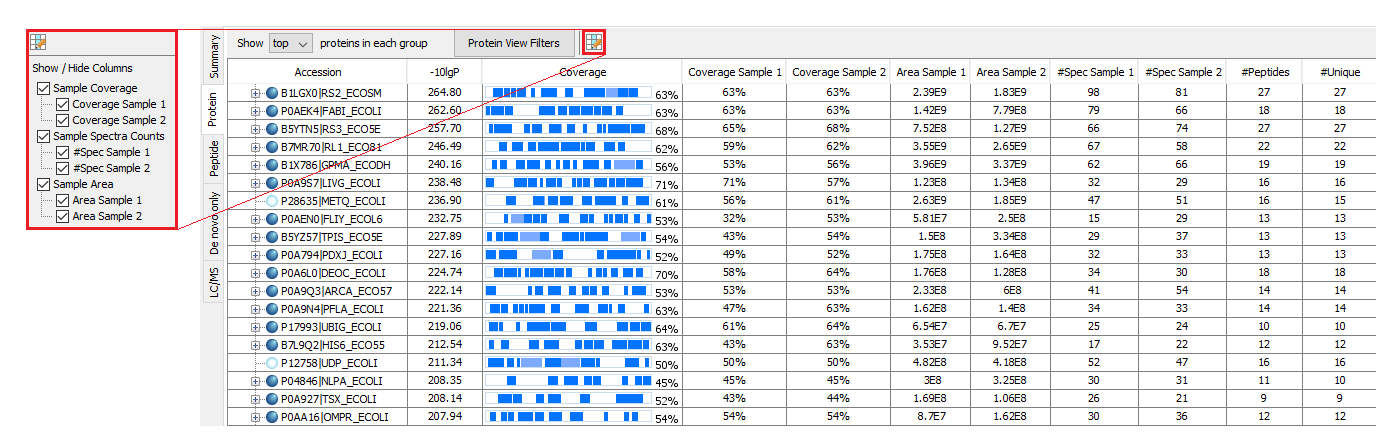
Global Comparative View
- Protein/peptide spectral counts and MS1 area in each sample provided in identification result for semi-quantitative analysis
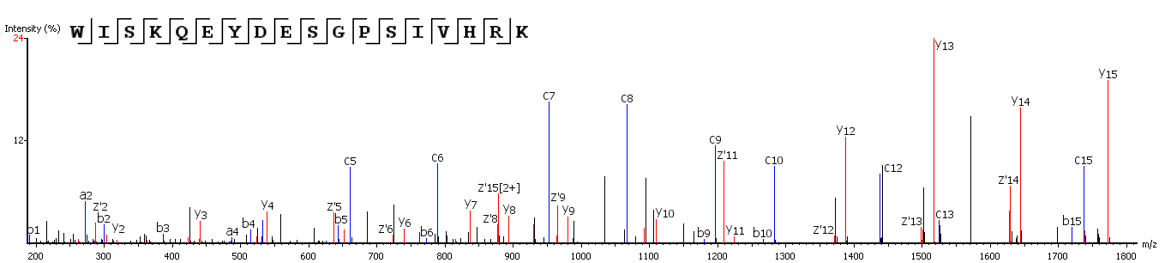
EThcD Data Analysis
- Advantages of EThcD fragmentation enables confident peptide identification