Retention Time mz Shift Distribution
Figure 4
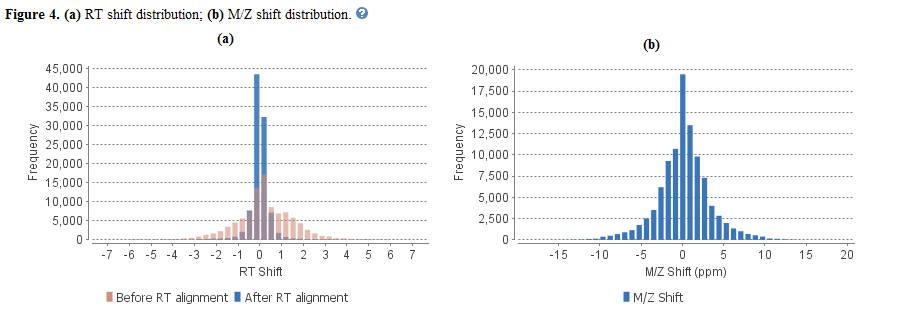
Figure 4(a) plots the retention time shift distribution to the base sample. The distribution of m/z shift (in ppm) of the data with respect to the base sample is plotted in Figure 4(b). These two figures can be used to refine the parameter setting for label free quantification. Initially we suggest setting a wider tolerance for both retention time and M/Z. After the quantification is done, check the red bars in 4(a). As in this example, most red bars are within 4 minutes. Thus 4 minutes can be used instead of initial setting 7 minutes. 4(b) can be used the same way.


