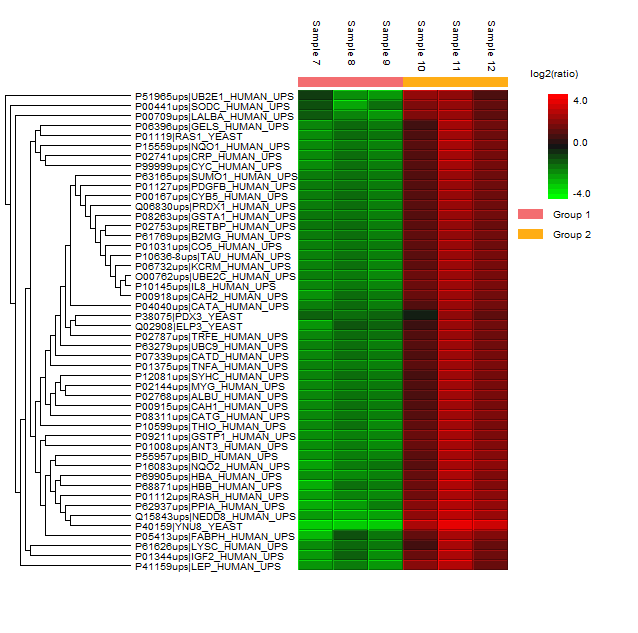
Protein Profile Heatmap
Only those protein groups which passed the filter are displayed in the protein profile heatmap. The relative protein abundance is represented as a heat map of the representative proteins of each protein group. The representative proteins are clustered if they exhibit a similar expression trend across the samples. The hierarchical clustering is generated using neighbor joining algorithm with a Euclidean distance similarity measurement of the log2 ratios of the abundance of each sample relative to the average abundance.