
PEAKS 
Protein Quantification
Overview
To understand the functions of individual proteins in complex biological systems, it is often necessary to measure changes in protein abundance. For example, Biomarker discovery and validation studies typically require quantitative analysis of proteins to identify and verify potential biomarkers that show protein expression changes significantly between different states/conditions. PEAKS Q allows the scientist to determine relative protein abundance changes across a set of samples simultaneously by labelling or label-free quantification using LC-MS/MS.
Highlights
- Identification-driven and feature-based quantification for DDA
- Support for both label-free and labelling data, including:
- SILAC, iTRAQ, TMT(MS2/MS3)
- Support complex experimental design
- Detailed data interpretation and visualisations
- Fragment based LFQ for DIA
Algorithm logic for identification-based and feature-based quantification
Identification-based Q
- Feature detection
- Feature identification association
- Retention time alignment and feature matching
- Relative abundance calculation
- Significance assessment
Feature-based Q
- Feature detection
- Retention time alignment and feature matching
- Relative abundance calculation
- Significance assessment
- Feature identification association
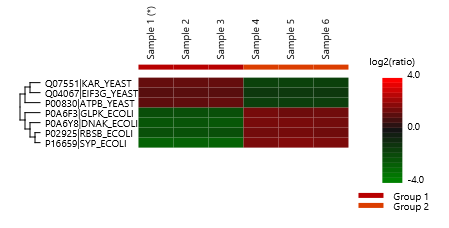
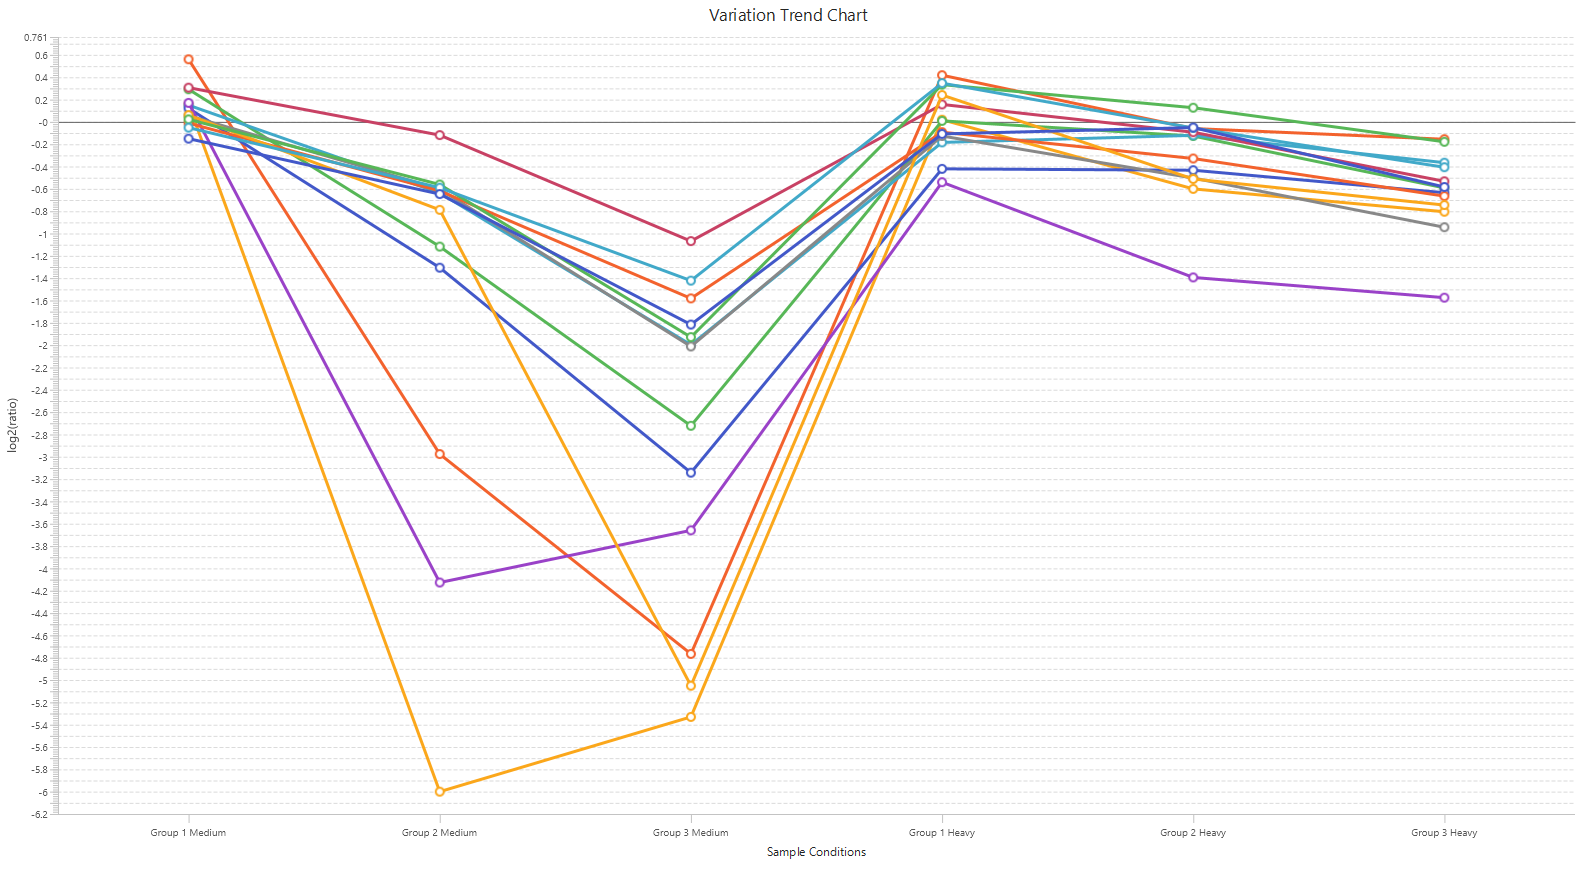
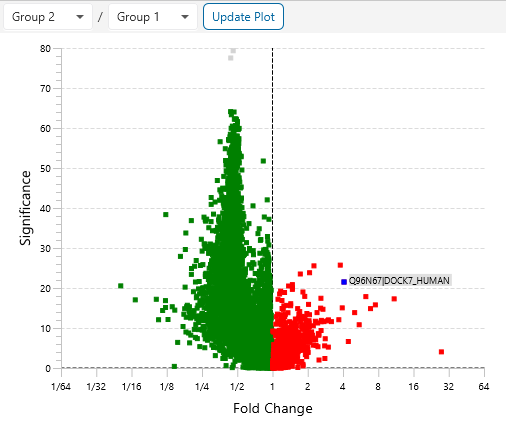
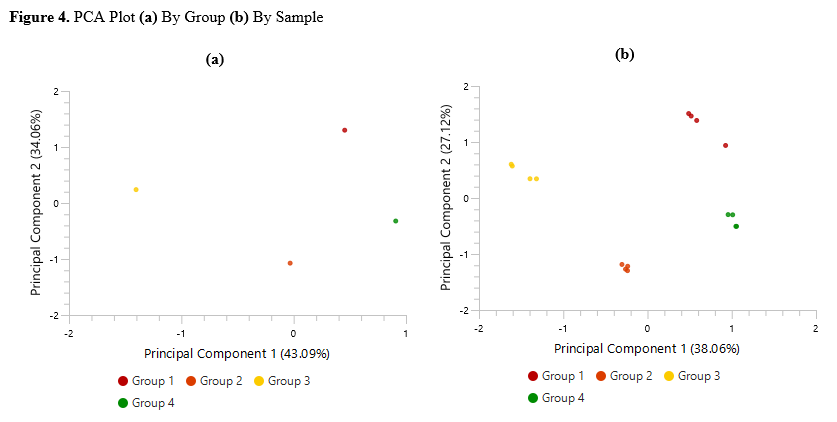
Detailed data interpretation and visualisations include Heat maps, Variation Trend plots, Volcano plots, and PCA sample and group plots
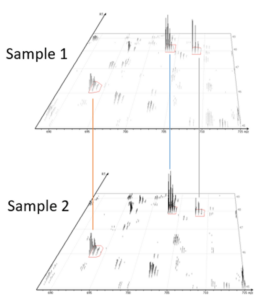
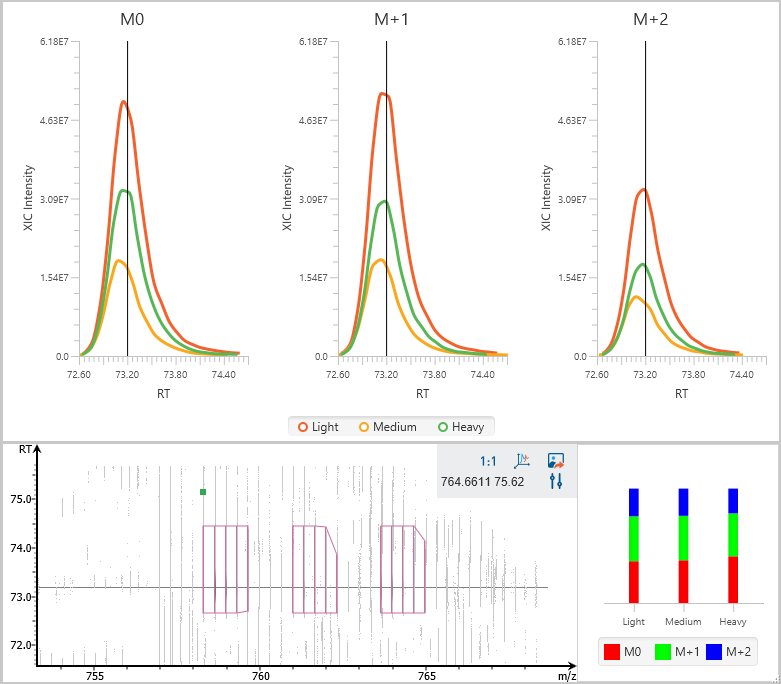
Stable isotope labelling using amino acids in cell culture (SILAC) is a powerful method to identify and quantify relative differential changes in complex protein samples. It has become the most common approach for in vivo isotopic labelling and popular method for quantitative proteomics.
The PEAKS Q module in PEAKS adopts
- enhanced SILAC feature pair detection algorithm, and
- SILAC alignment and ID transfer techniques to successfully improve the quantification accuracy and sensitivity. It uses ratio-focused quantification, which enables the data analysis for super-SILAC experiments.
It enables applications such as time series quantification by introducing multiple group comparison. This new PEAKS Q module also implements paired t-test and Welch’s ANOVO for single-group analysis and multi-group comparison, respectively. Learn More
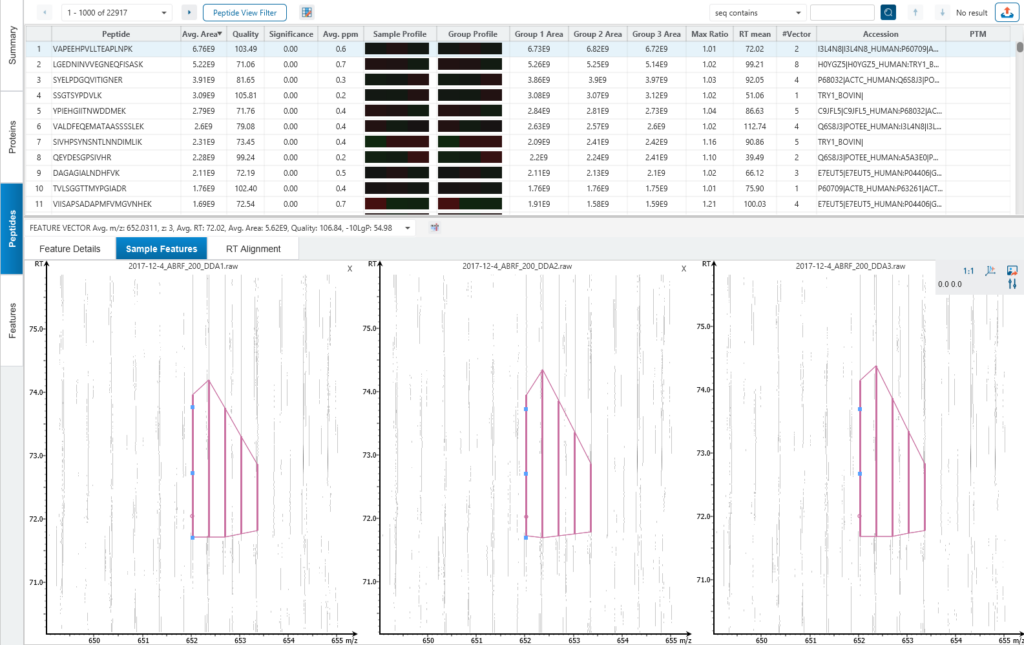
Protein relative quantification in PEAKS is performed using ion peak intensity at MS1 (DDA) and MS2 (DIA) levels. In label-free quantification experiments, samples are separately collected, prepared and analysed by LC-MS/MS. Because of the large amount of data collected from these experiments, sensitive and accurate algorithms are used in PEAKS for automated ion peak alignment and comparison.
For DDA acquisitions, label free quantification is performed based on MS1 feature abundances. Typically, three most quantifiable unique peptides are selected for protein ratio estimation. Excluded by default are peptides with both modified and unmodified forms, and outlier peptides.
Different approaches to the t-test or ANOVA are required for robustly comparing pairs of independent or related samples. When a large number of tests are performed, P values are interpreted differently for more accurate estimation of false discovery rate (FDR). Learn More
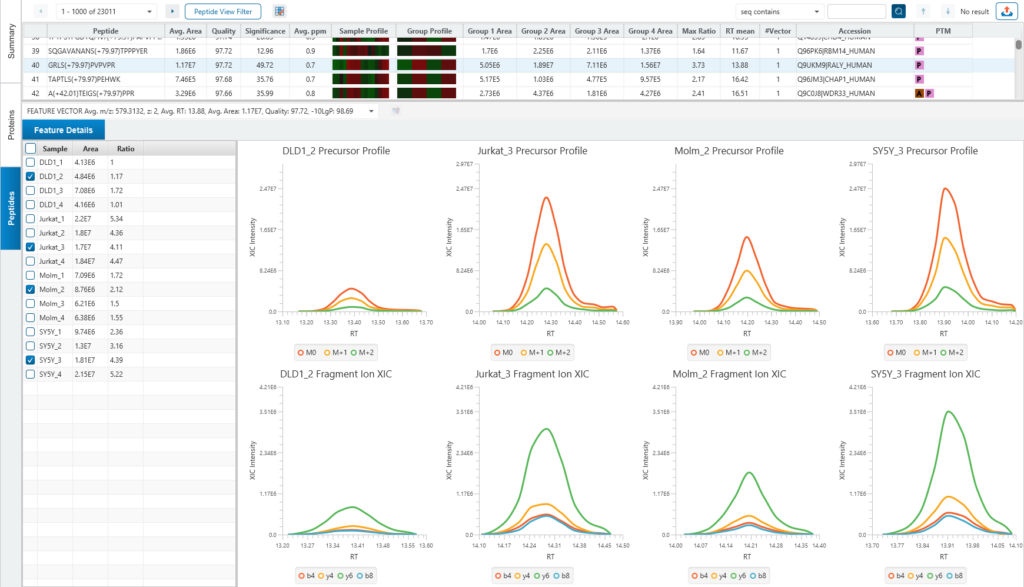
Protein relative quantification (for DIA data) in PEAKS is performed using ion peak intensity on MS2. In label-free quantification experiments, samples are separately collected, prepared and analysed by LC-MS/MS. Because of the large amount of data collected from these experiments, sensitive, accurate and reproducible algorithms are used in PEAKS for automated ion peak alignment and comparison.
PEAKS Studio 12 use an AI-driven algorithm to select appropriate fragment ions automatically. The basic idea is to select those ions which are (1) most common across all samples (2) has good elute shapes (or correlation) (3) fit to Deep Learning-based predicted retention time (RT) and MS2 spectra.
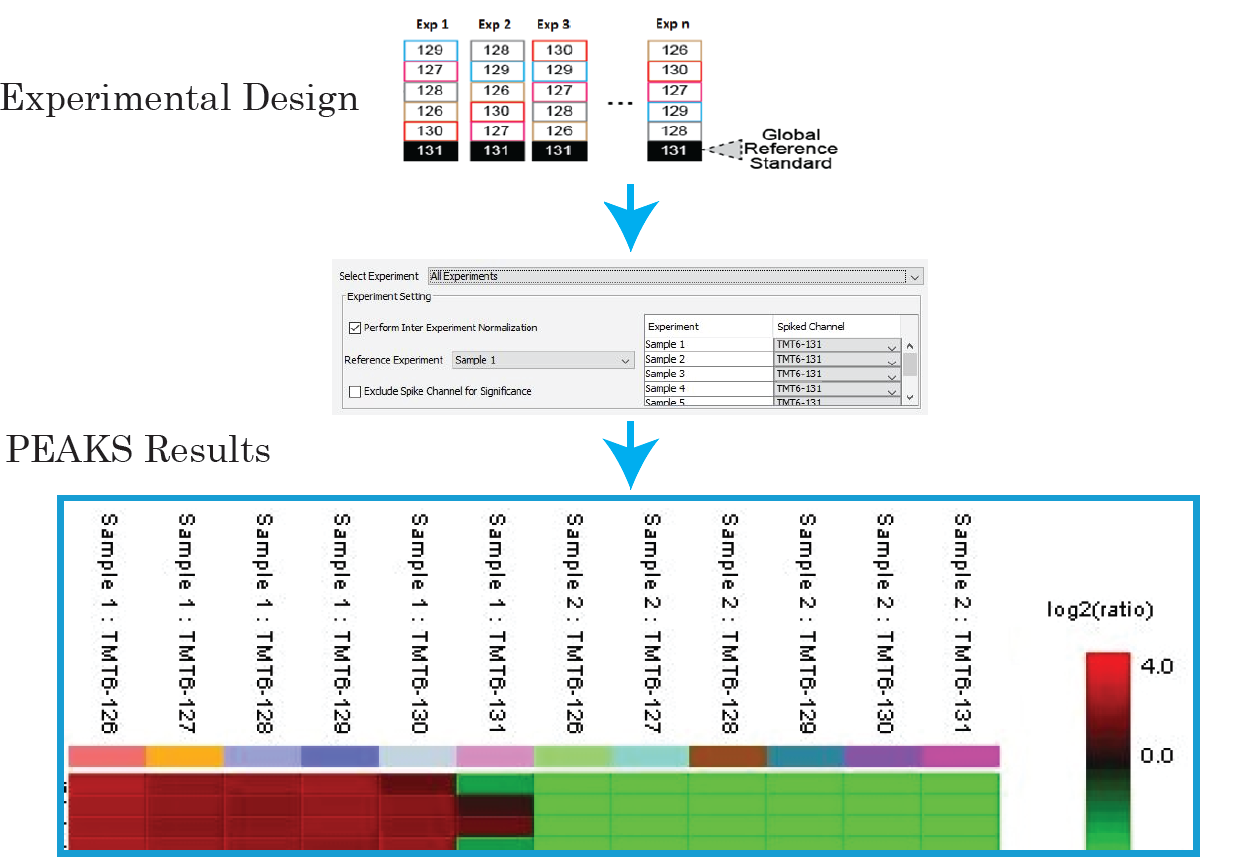
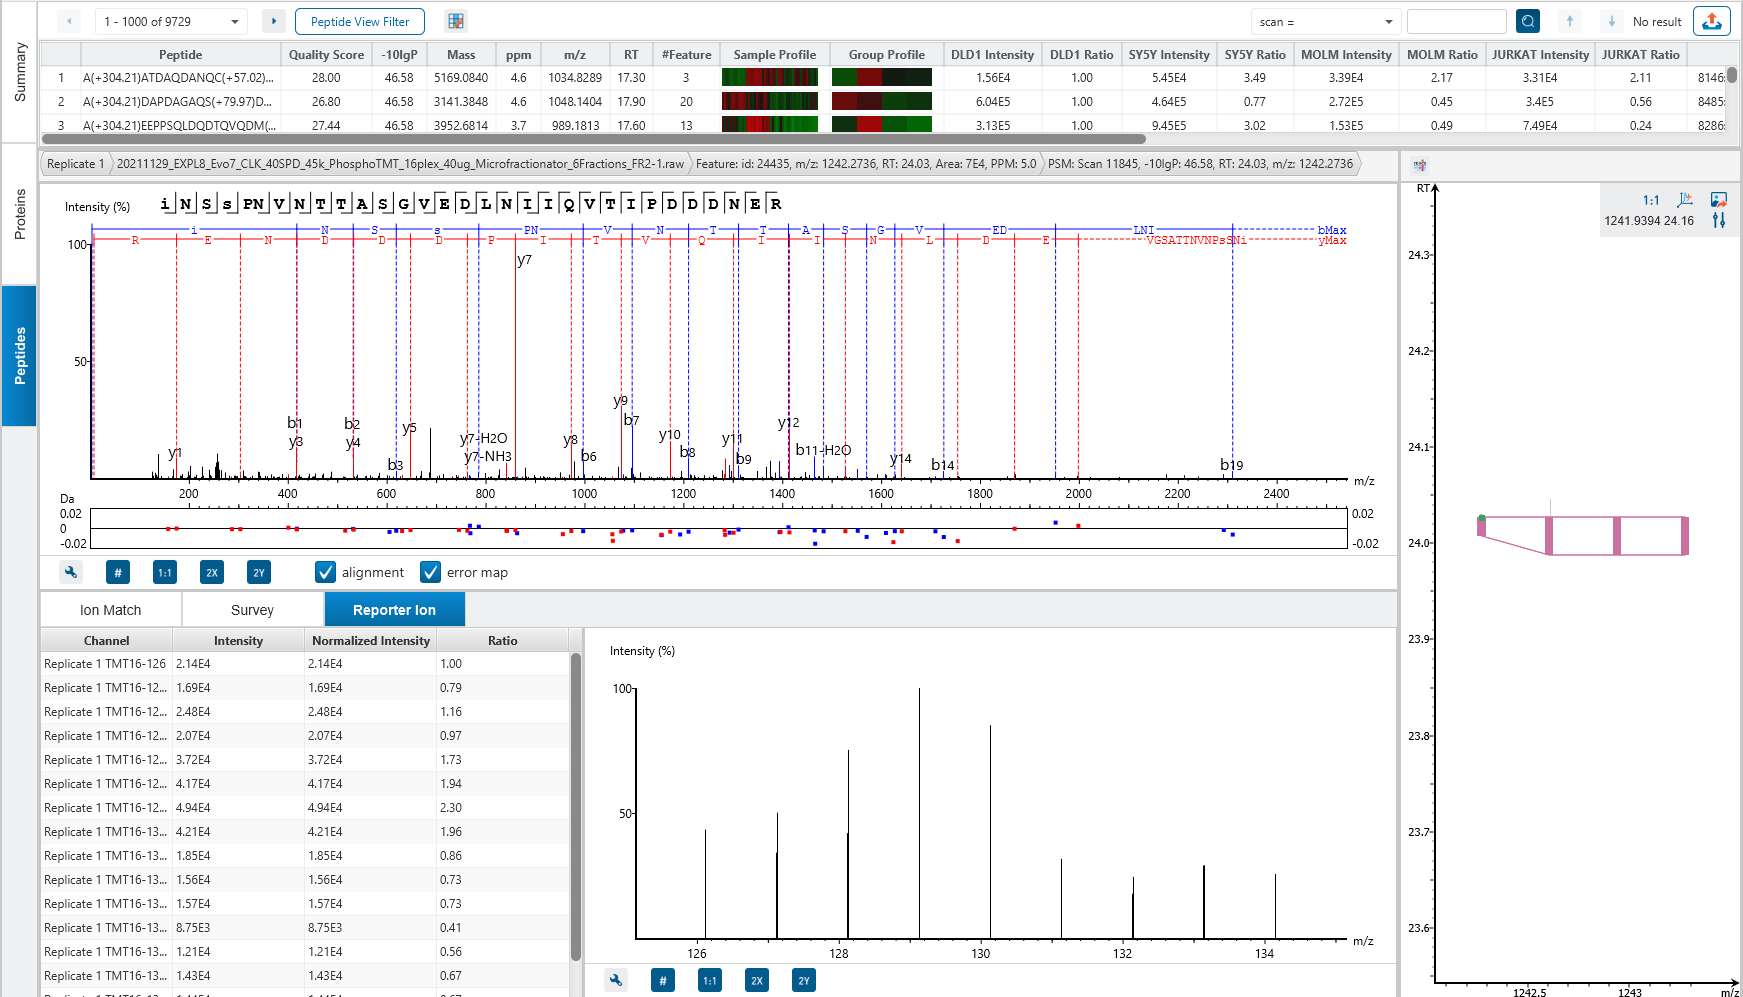
Isobaric tags (TMT or iTRAQ) have identical masses and chemical properties that allow heavy and light isotopologues to co-elute together. The tags are then cleaved from the peptides by collision-induced dissociation (CID) during MS/MS, which is used for quantification.
One of the challenges for such methods is reporter ion ratio distortion resulting from fragmentation of co-isolated interfering species.
The MultiNotch MS3 method addresses this issue by uniquely combining multiplexing capacity with quantitative sensitivity and accuracy. PEAKS supports both MS2 and MS3 quantification.
With PEAKS, you can now expand your sample size for large-scale protein quantification studies, with reference channels to ensure the accuracy of quantification. Learn More
References
- Yang, W., et al. PEAKS Q: Software for MS-based quantification of stable isotope labeled peptides. ASMS. WP531. 30/5/2006.
- Xin, L. et al. New Quantitation Software Package Based on PEAKS Protein ID. ASMS. TP 653. 2/6/2008.
- Chen, C., et al. New Algorithm for Label-Free Protein Quantification. ASMS. MPB 043. 31/05/2009.