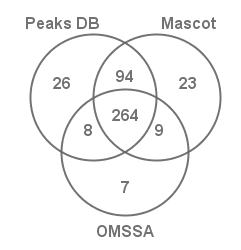
When the inChorus result contains no more than three engines, a Venn diagram will be displayed.
A Venn diagram shows the number of peptides identified by each possible combination of the engines.

Note: These numbers do not distinguish the high or low confidence for each engine’s score. For example, if a peptide got a high inChorus score but low scores in every individual engine, the peptide is still counted in the intersection of all engines in the Venn diagram. For this reason, this Venn diagram is NOT the best way to compare different engines’ performances.

